And you know what makes it amazing
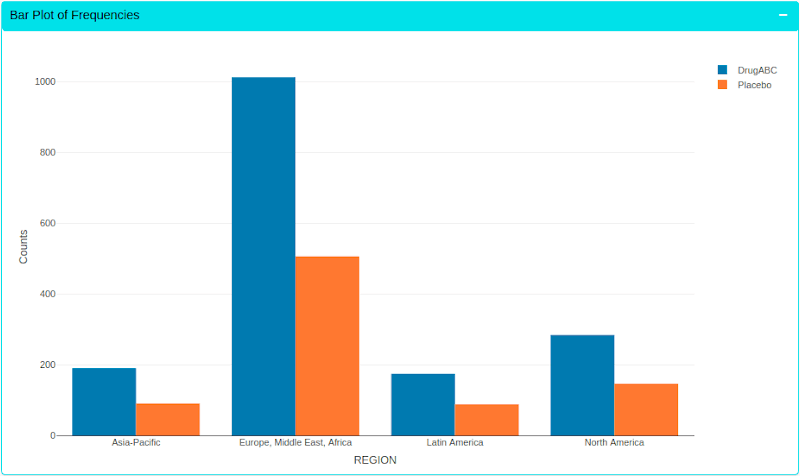
Instant Visualizations
Easily explore and visualize data, find hidden patterns and share with the teams instantly.
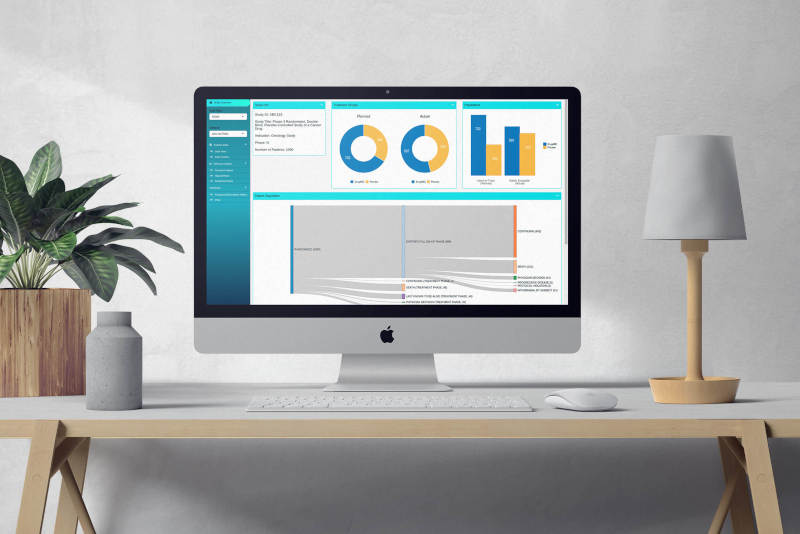
Study Dashboard
Dashboard shows up-to-date study information with patient flow, overview of safety and efficacy endpoints.
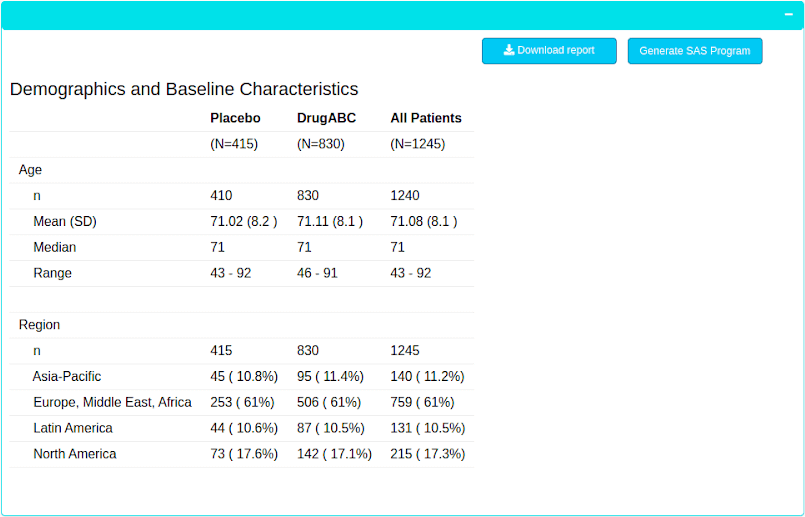
Report Generation
Any team member can interactively create custom reports, without writing any code. Submission ready SAS programs can be generated by clicking a button. Reports are also shareable across teams
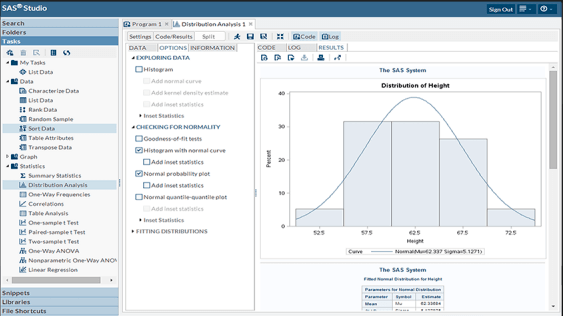
SAS Studio Integration
MLytics Studio version control directly integrates with SAS® Studio version control. Programs generated through Autopilot, Guided Auto or Playground can be freely modified or customized in SAS® Studio, providing users complete control of the program functionality.
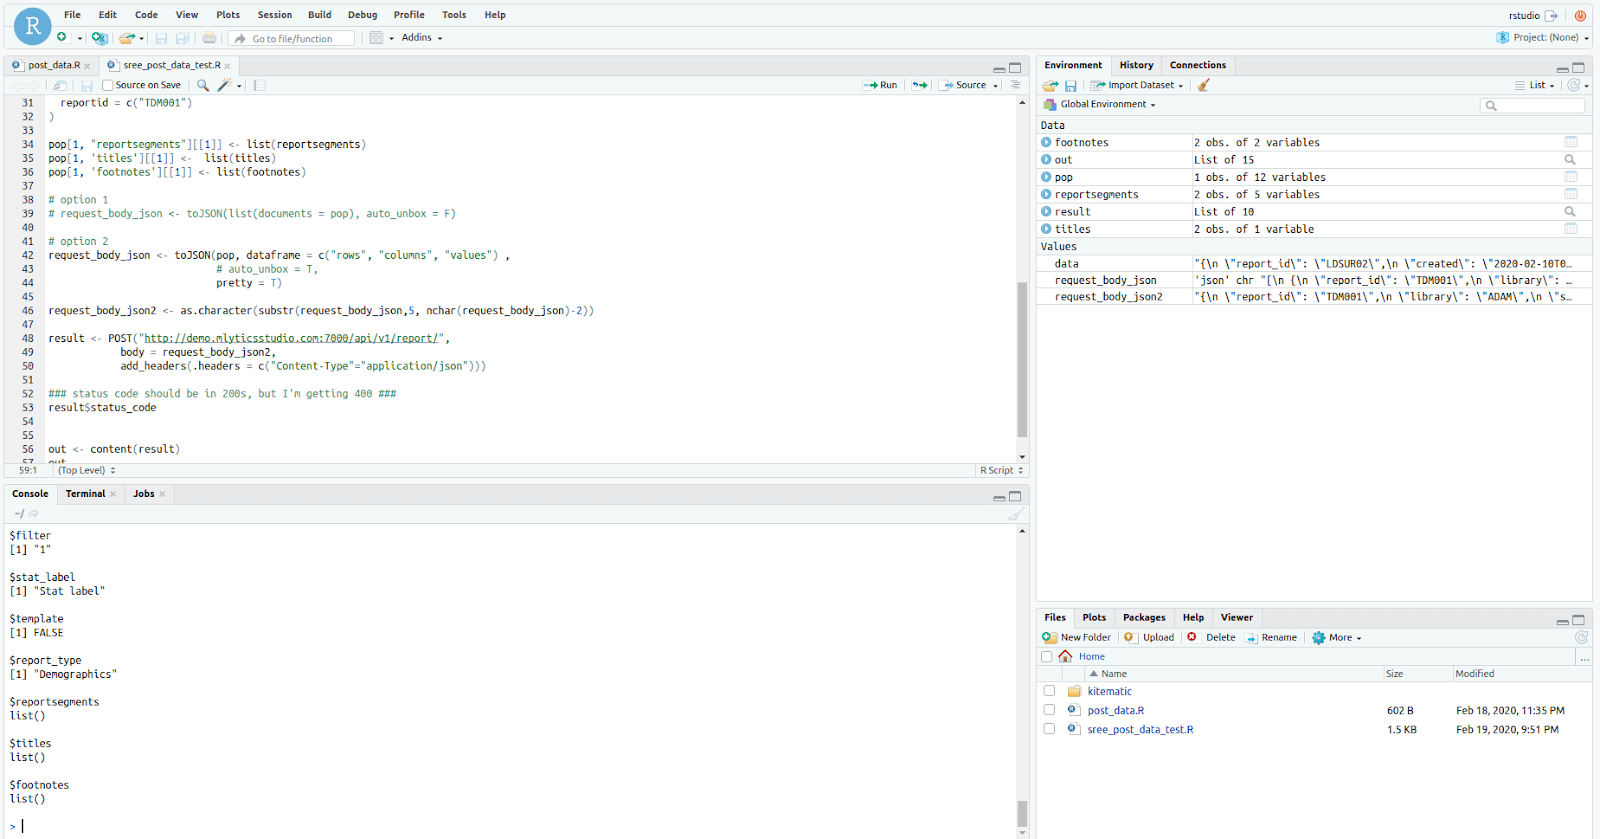
R Studio Integration
Provides an integrated platform for leveraging the free and open-source software (FOSS), with its ever expanding array of useful packages for data exploration, analysis and visualization.
Burndown Chart
The chart displays planned vs. actual progress during a milestone. It provides a clear picture of how the team is progressing towards the goals.

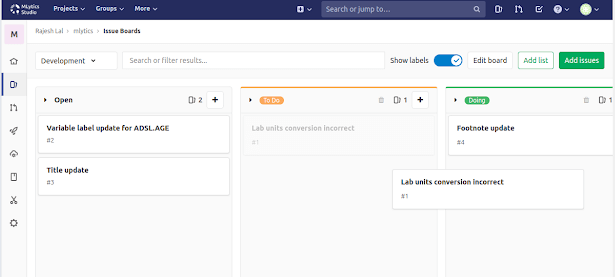
Project Tracking
Organize issues and updates among team members using Kanban boards and get the big picture of who is doing what. Easily update the status of your assignments by dragging the items between lists
Scalability, Compatibility and Security
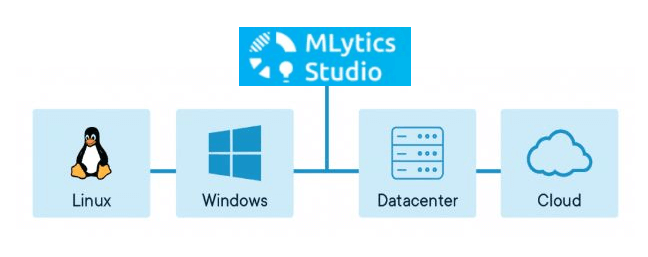
Mlytics Studio is scalable by design. By leveraging Docker and Kubernetes technologies, the application is scalable from 10s to 1000s of users. The application is compatible with all major platforms currently in use in the industry, works well with existing infrastructure, systems and processes and is secured by industry standard encryption.
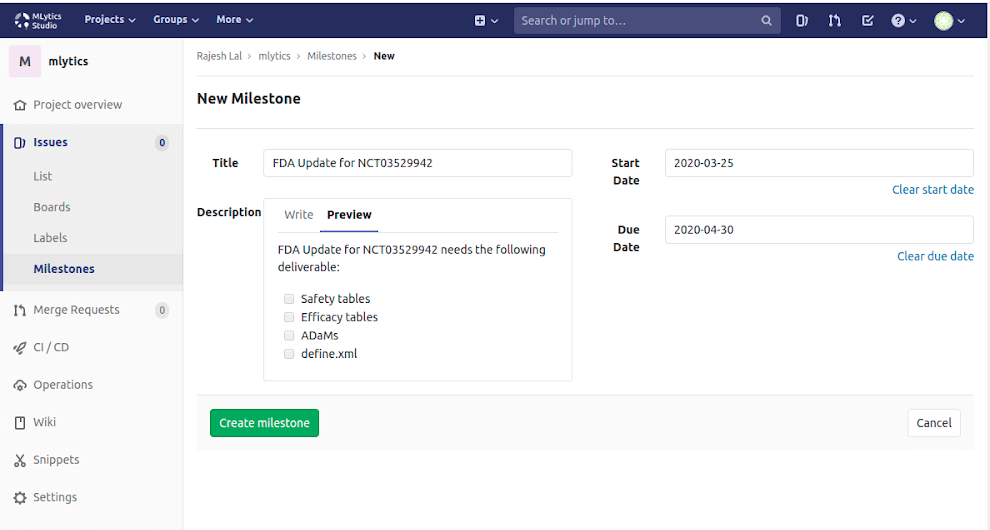
Project Planning
Allows project managers/leads to effectively manage teams and workloads. Easily create milestones, and organize tasks and deliverables to closure.
